Use a template
Pick a ready-made design, replace the sample data with your own, and customize the chart.
Start with a template, build from scratch, or describe the chart you want and let AI create an editable design.






Choose a starting point and replace the example values with your data.
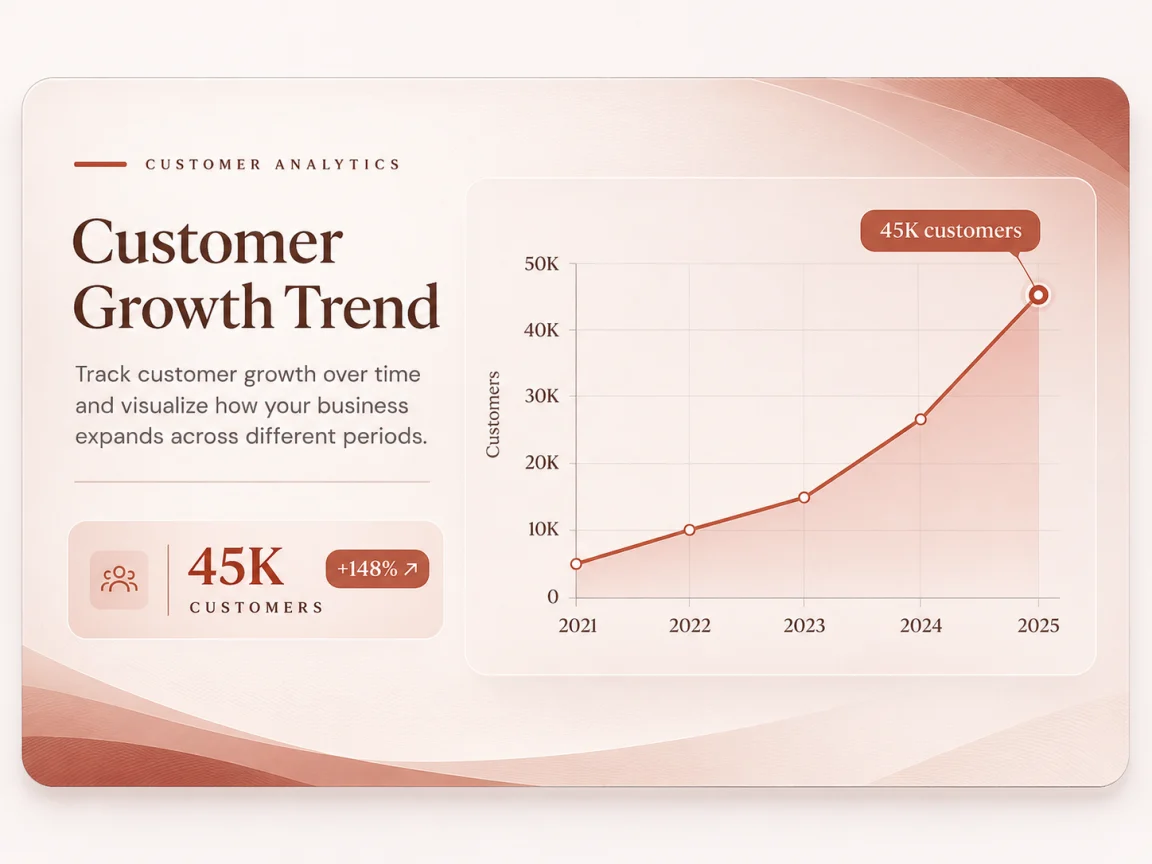 Business
Track how your customer base grows year over year.
 Analysis
Compare aperture settings across shutter speeds.
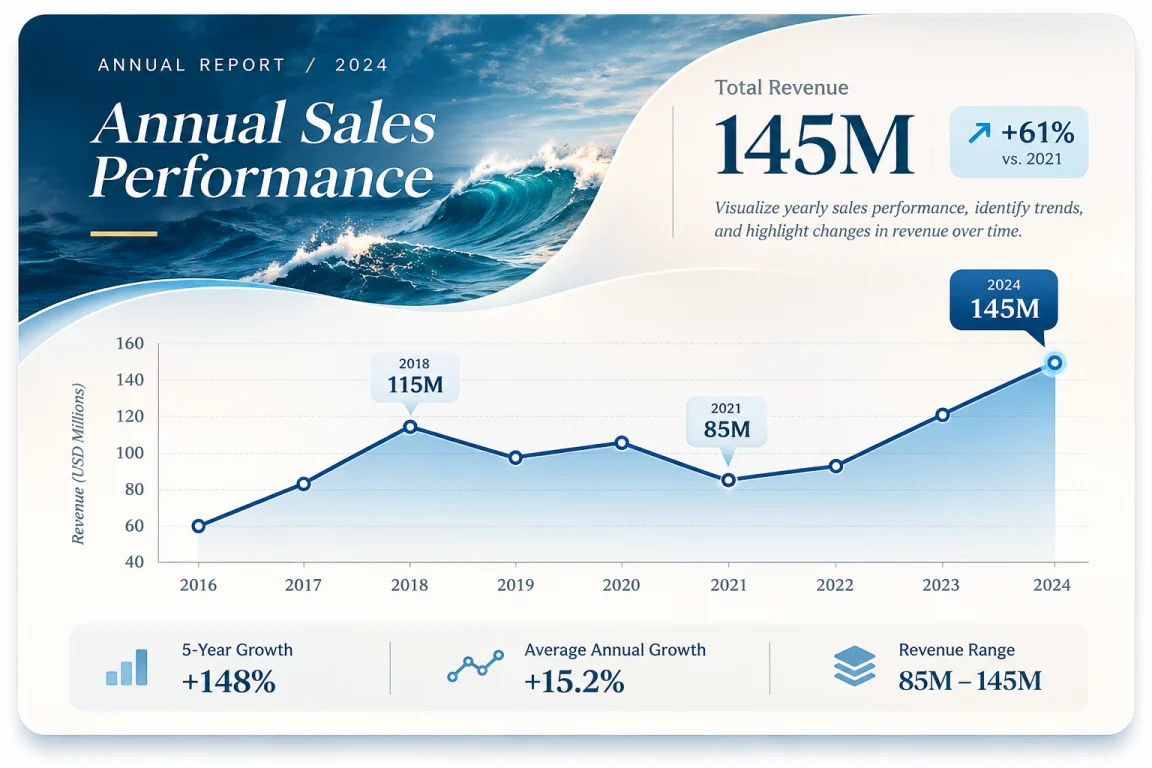 Business
Show long-term sales trends and changes in revenue.
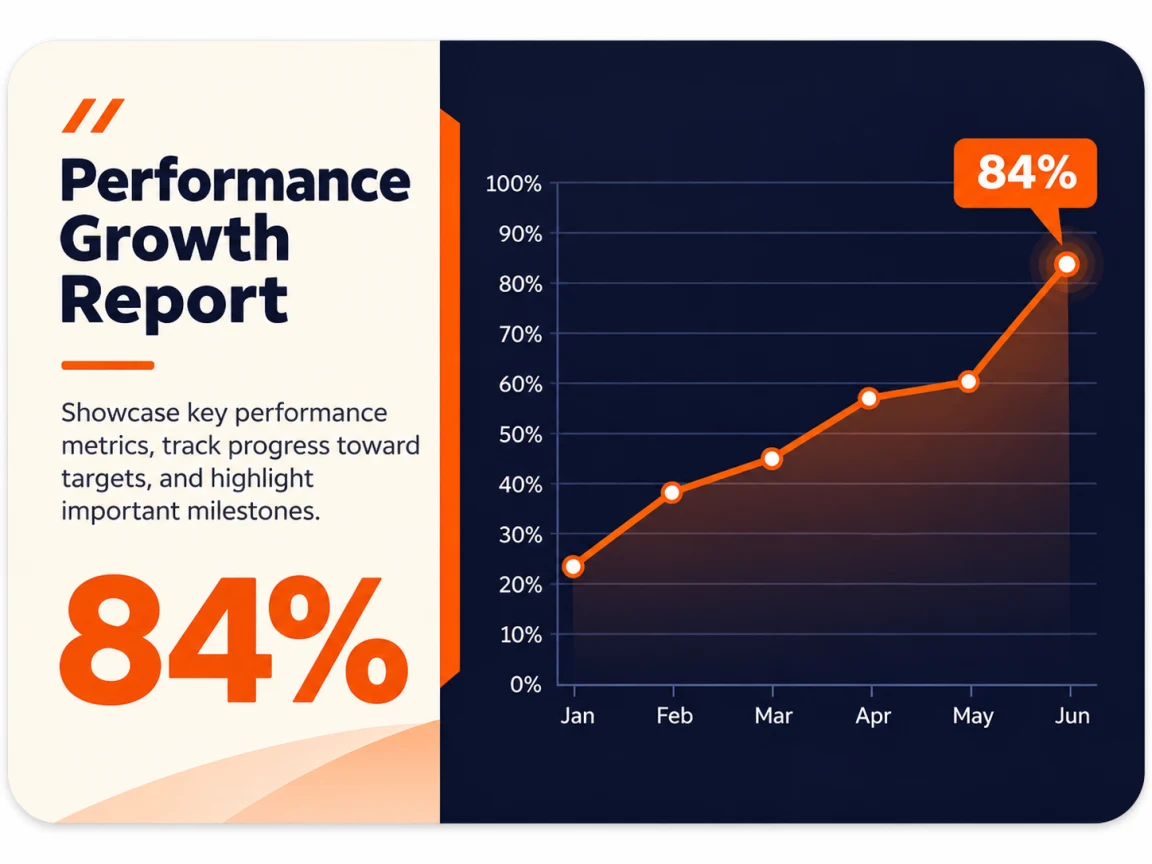 Reports
Show how a performance metric moves toward its target.
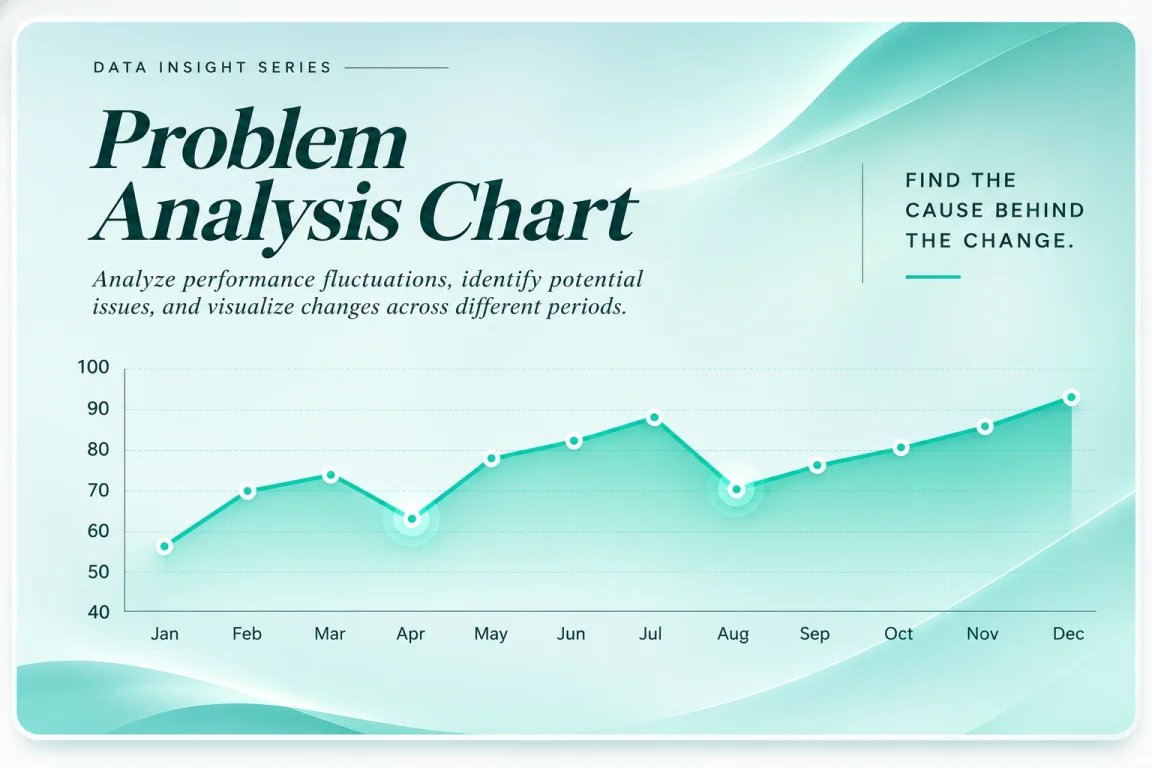 Analysis
Spot dips and recoveries in a monthly performance series.
 Business
Present a quarterly growth projection.
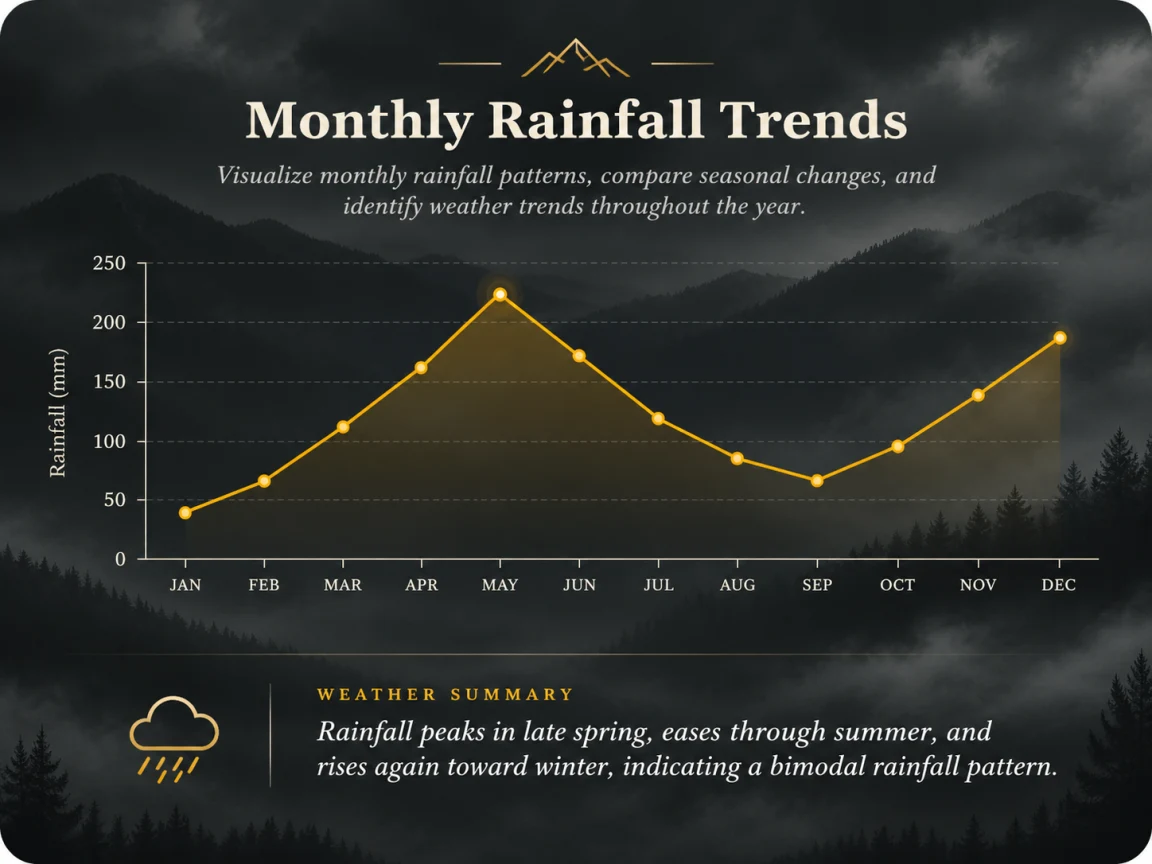 Time series
Compare monthly rainfall and see seasonal peaks.
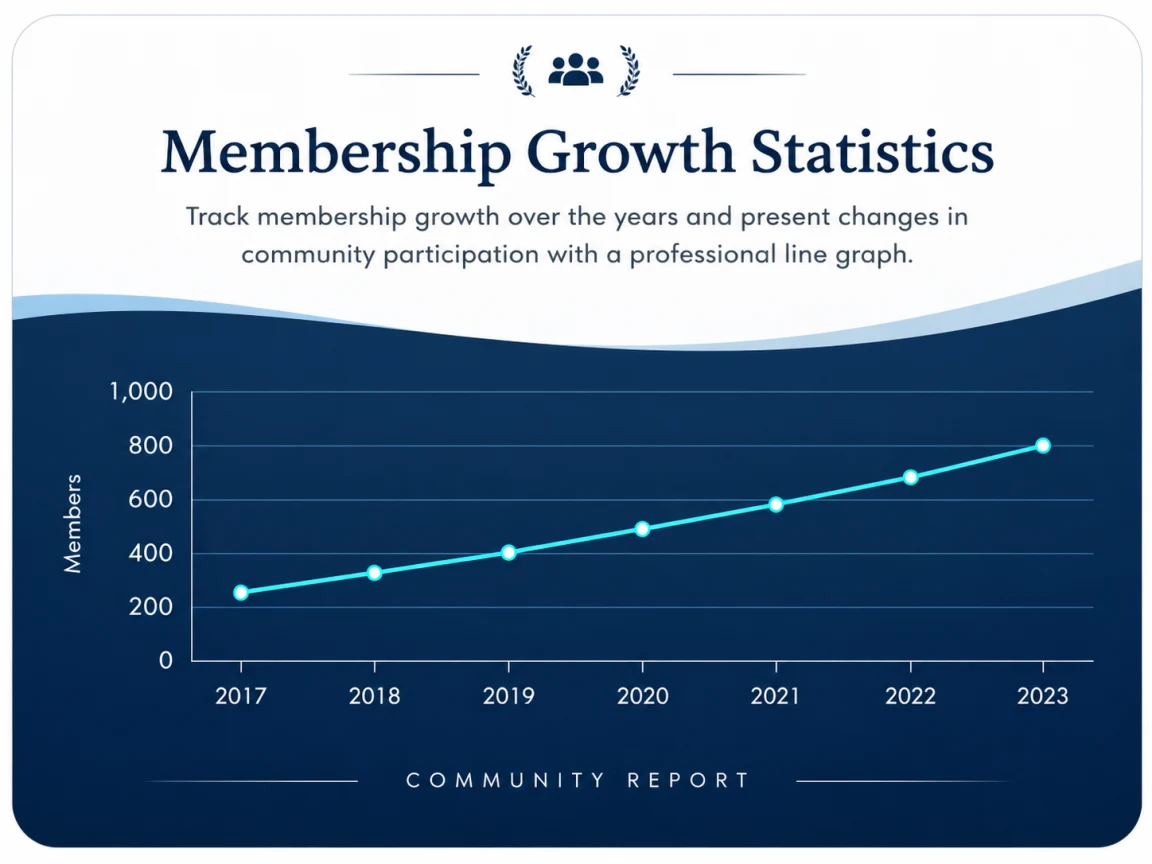 Reports
Track annual membership totals for a community or association.
8 of 11 templates shown
From the first pasted cell to the final chart, work directly in your browser.


Open a template or a blank chart, or ask AI to create an editable design for your data.
Paste cells, type directly or import a CSV or Excel workbook. Review the columns before applying.
Adjust the axes, colors, line styles and legend to make the data clear.
Preview the final size and download a PNG, SVG or PDF.
Keep editing in this browser or download a project file you can reopen elsewhere.
Start in a spreadsheet, then bring the same data into MakeLineGraph.
Yes. You can browse templates, edit and download a chart, and save a project in this browser without creating an account.
Paste cells from Excel or Google Sheets, or choose a local CSV or XLSX file from the Data panel. Review the column mapping before you apply it.
Yes. Adjust line styles, colors, titles, axes and labels, then review the chart at your chosen output size.
Save a project in this browser or download a .mlg.json project file to reopen it in another browser.