Business
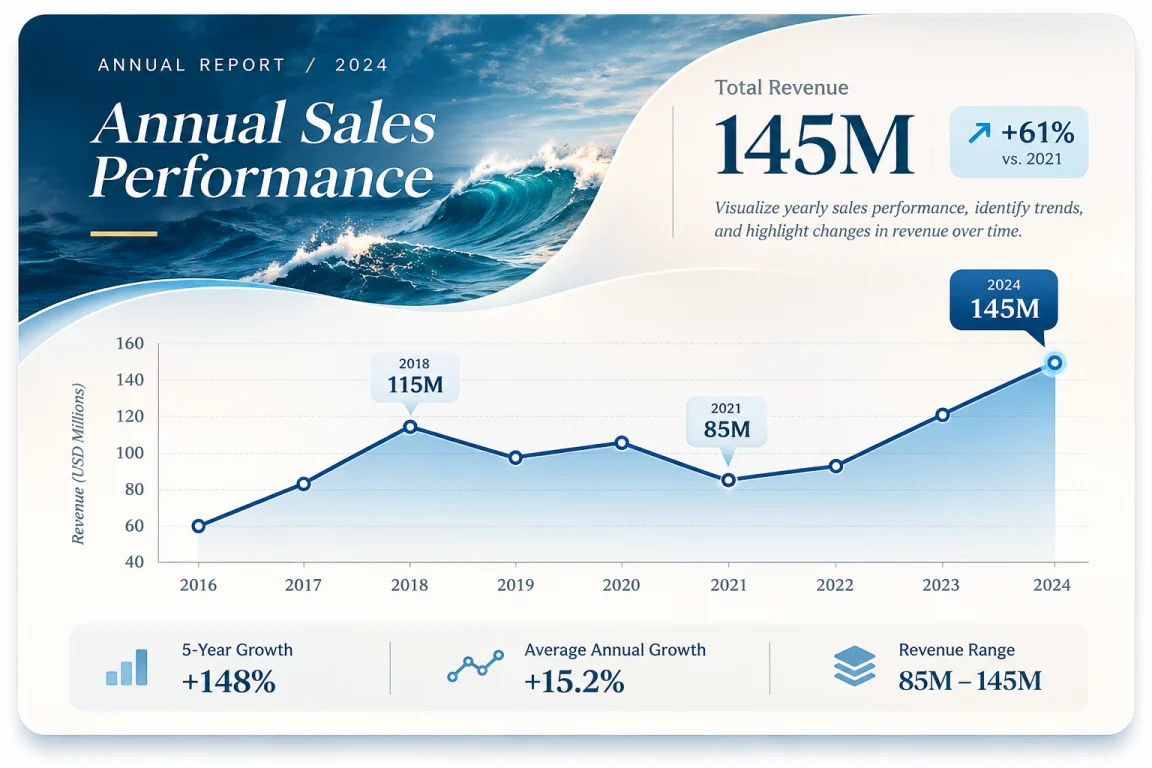
Annual Sales Performance Record one revenue total per year in millions of US dollars. The summary uses the latest value, consecutive-year growth rates, and the full revenue range.
Use template
X axis Year · category
Output preset Custom size Edit template Editable design preview Change the text, background, chart style, and sample data in the editor.
A N N U A L R E P O R T 2024 Annual Sales Performance Total Revenue 145M +71% vs. 2021 Visualize yearly sales performance, identify trends, and highlight changes in revenue over Revenue (USD millions) 40 60 80 100 120 140 160 2016 2017 2018 2019 2020 2021 2022 2023 2024 2018 115M 2021 85M 2024 145M 5-Year Growth +48% Average Annual Growth +14.0% Revenue Range 59M – 145M Example data Sample values were estimated from the design.